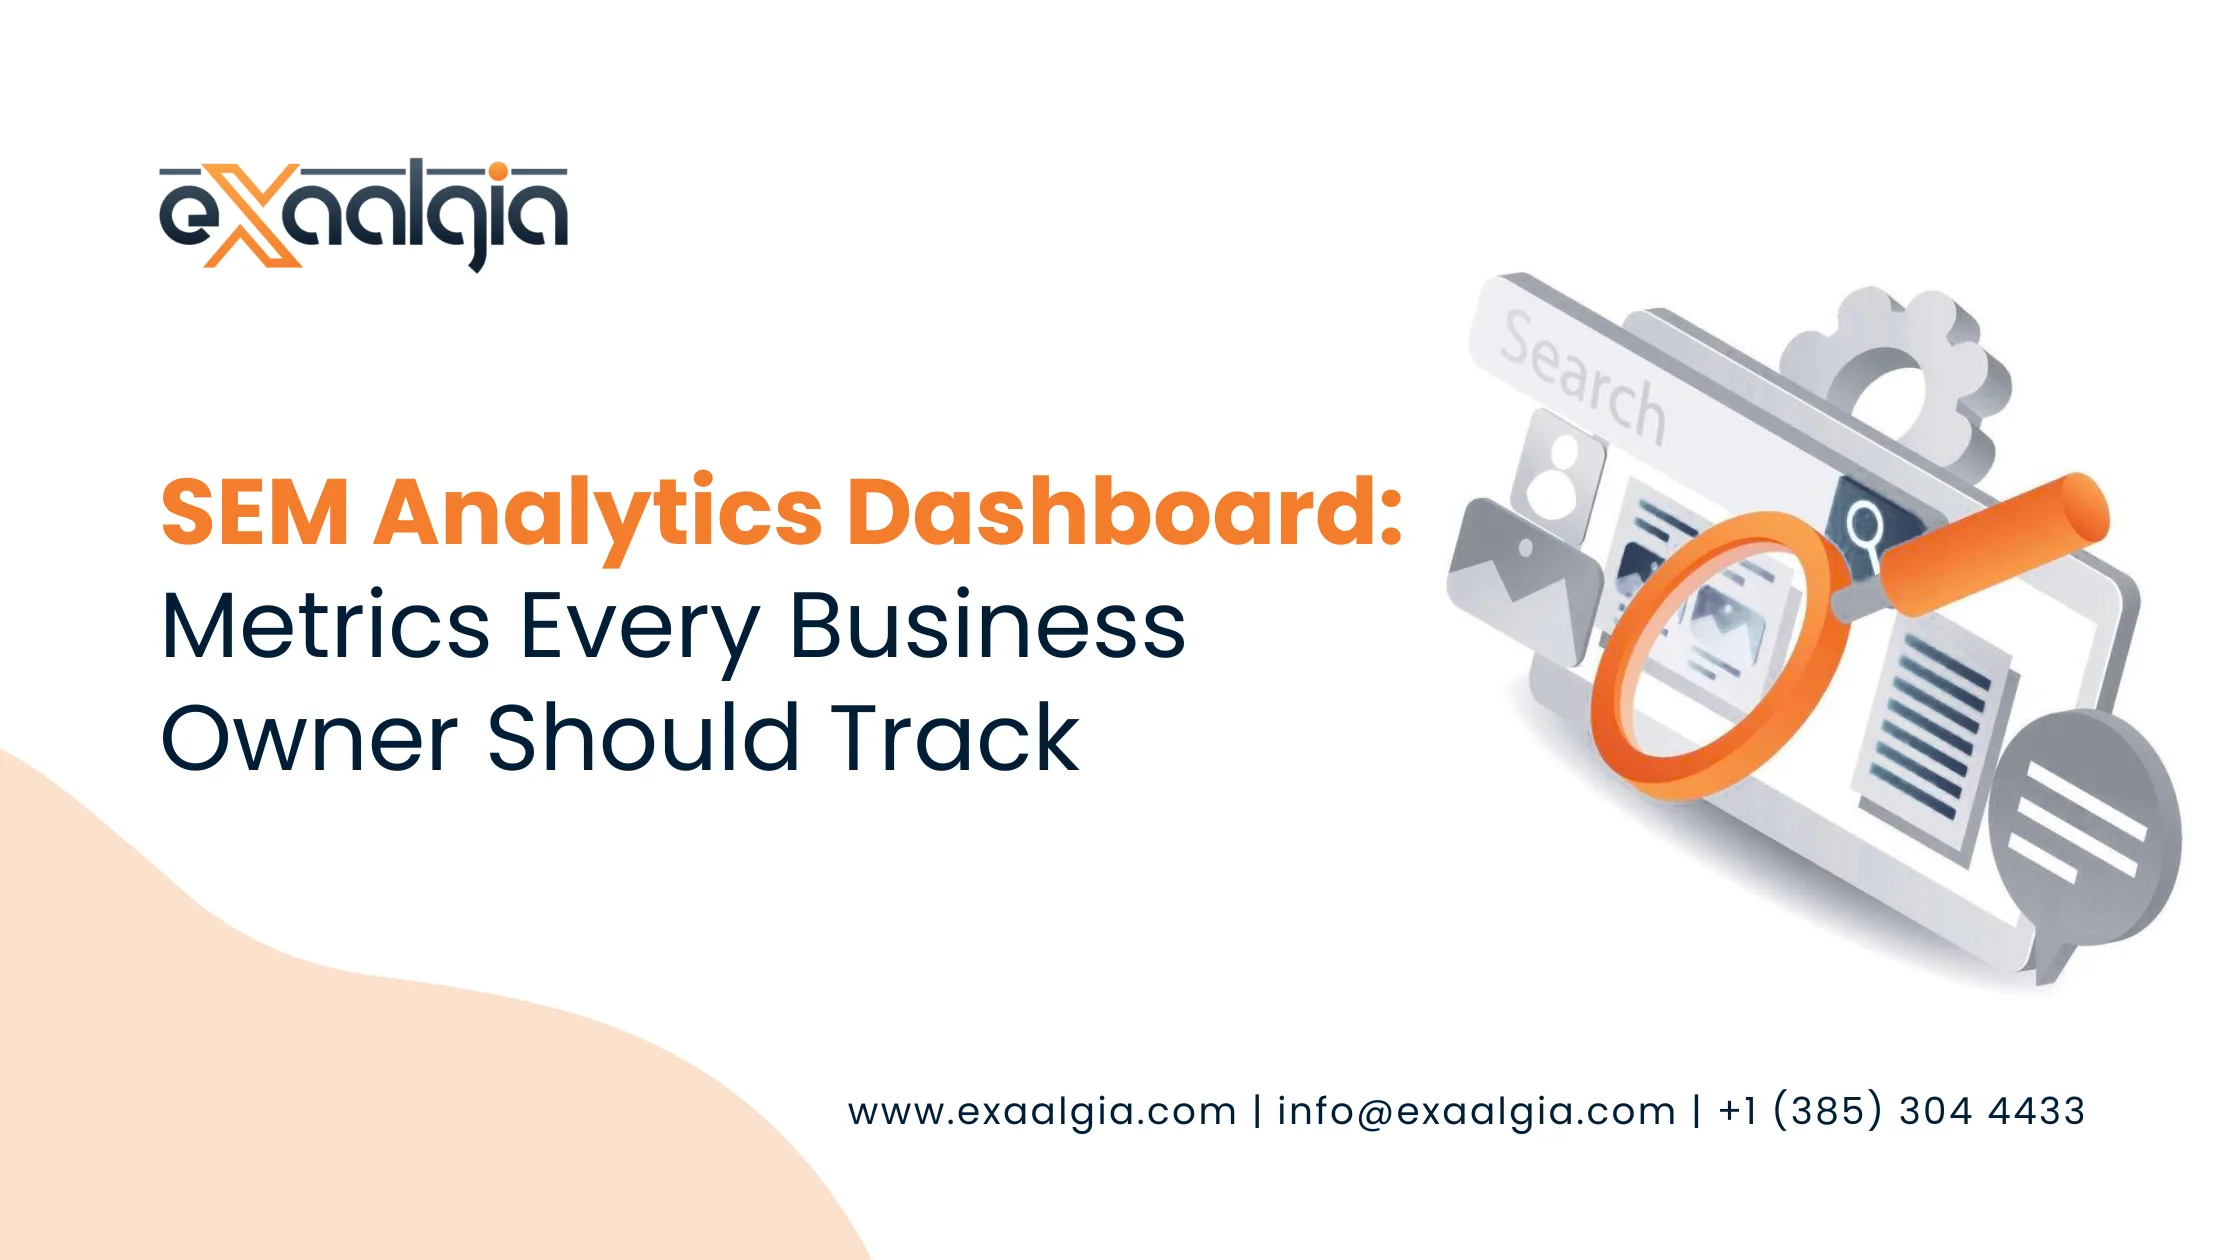
Search engine marketing (SEM) enables your brand to reach users who actively search for your products. This system has great power which requires users to learn which performance indicators they should observe and understand those indicators before they can decide what moves to make. The absence of clear data leads to wasted advertising expenses which result in minimal outcomes.
In this guide, we’ll walk you through the most important SEM metrics that should appear on every business owner’s dashboard, explain what each one means in plain language, and show you how to use them to make smarter decisions. If you’re looking to enhance your paid search performance, Exaalgia’s expert SEM services are designed to take your campaigns from underperforming to unstoppable.
Why an SEM Analytics Dashboard Matters
Imagine your SEM analytics dashboard as the control panel to your paid search campaigns. It also consolidates the data of such platforms as Google Ads and Microsoft Ads into a single place so that you can monitor the performance, identify the issues, as well as the opportunities all in real time.
In its absence, business owners usually have three significant areas of pain:
- Unutilized amount on advertisements that are not performing as expected with respect to performance.
- There is no apparent idea of what is driving conversions and not clicks.
- Inability to scale what’s working or cut what isn’t
“Half the money I spend on advertising is wasted; the trouble is I don’t know which half.” — John Wanamaker, Retail Pioneer
A well built SEM dashboard eliminates that guesswork. It shows you exactly which half is working, and gives you the data to double down on it. Whether you manage campaigns in-house or leverage professional digital marketing services, having the right dashboard is non negotiable.
The Essential SEM Metrics at a Glance
Before we break down each of these metrics, herewith is a ready reference of essential KPIs that business owners need to monitor in their SEM analytics dashboard:
| Metric | What It Measures | Ideal Range | Priority |
| CTR (Click-Through Rate) | Ad relevance & appeal | 5%–10%+ | 🔴 High |
| CPC (Cost Per Click) | Ad spend efficiency | Industry-specific | 🔴 High |
| Conversion Rate | Lead/sale generation | 3%–10%+ | 🔴 High |
| Quality Score | Ad + landing page match | 7–10 (ideal) | 🟡 Medium |
| ROAS | Revenue per ad dollar | 4:1 minimum | 🔴 High |
| Impression Share | Market visibility % | 70%+ (target) | 🟡 Medium |
| Cost Per Acquisition | Cost per new customer | Below CLV | 🔴 High |
| Bounce Rate (PPC) | Landing page relevance | <50% ideal | 🟡 Medium |
Up next, let’s delve deeply into each of these metrics.
1. Click Through Rate (CTR) – Your Ad’s First Impression
CTR is used to gauge the frequency of people who view your ad actually click on it. Calculated as: (Clicks 1/Impressions) × 100. An increase in CTR is a good sign that your ad copy is relevant and convincing to your target audience.
Why it is important to business owners:
- Low CTR = your advert is not getting a response, it is time to rephrase your headlines or advertisement copy.
- High CTR and low conversions = traffic issue (wrong audience) or landing page issue.
- The average CTR of Google Search Ads is approximately 6-7% though the industry leaders may have a CTR that is much higher, in the range of 10-15%.
Pro Tip: Performs A/B testing on ad headlines on a regular basis. Change of words can make a tremendous difference in CTR and lower your average cost per acquisition.
2. Cost Per Click (CPC) – Managing Your Spend Per Visitor
CPC explains to you the amount that you are paying per visitor who clicks on your advertisement. CPC in Google Ads is affected by competition, your Quality Score and bid strategy. Keeping track of CPC will allow you to control your budget, and make sure that you are not overcharging on traffic.
Key CPC insights to track by:
- Keyword: Find out which keywords are costing you money without producing results.
- Device: Mobile vs. desktop CPCs can have a large difference.
- Trends in time: The abrupt spikes can be related to the enhanced competition or seasonal demand.
Reducing your CPC without compromising on quality is one of the fundamental objectives of the professional management of SEM campaigns. It has a direct effect on the distance your budget will take you in relation to the amount of leads you will produce at the same level of spend.
3. Quality Score – Google’s Rating of Your Ads
Google uses Quality Score (QS) to evaluate the relevance and quality of your keywords, ads, and landing pages on a scale from 1 to 10. The metric stands as one of the most essential elements for SEM analytics yet most people fail to recognize its existence.
| Quality Score | Impact on CPC | Ad Rank Effect |
| 1–3 (Poor) | Up to 400% higher CPC | Ads rarely shown |
| 4–6 (Average) | Standard market rate | Competitive position |
| 7–10 (Excellent) | Up to 50% CPC discount | Premium ad placement |
The process of improving your Quality Score leads to two benefits because it decreases your click costs while it enhances your advertisement ranking. Your landing pages should match user intent who search for your website and use specific keywords to access your site. Our complete SEM services show you the methods we use to improve Quality Scores for our clients.
4. Conversion Rate – Turning Clicks Into Customers
Your conversion rate will tell you what percentage of ad clicks result in a desired action – purchase, form fill, phone call, or any other goal you have set. It is arguably the business critical measure on your SEM analytics dashboard.
Formula: (Conversions ÷ Clicks) × 100
The following three areas should be considered by you in order to increase your conversion rate:
- Relevance of landing page: The message of the ad and the landing page should be the same to create trust and minimize the bounce.
- Page load time: A 1-second delay in load time can decrease conversions by 7 percent – mobile users are particularly in-your-face.
- Clear Call-to-Action (CTA): You must know what to do next, which can be, but is not limited to, Get a Free Quote, Book a Demo, Shop Now.
To understand how conversion rate optimization fits in with your overall strategy, read our blog on conversion rate optimization and how to cut wasted marketing spending.
5. Return on Ad Spend (ROAS) – The Revenue Reality Check
ROAS is a ratio of the amount of revenue you will get compared to every dollar you spend on adverts. It is one of the best predictors of the profitability of campaigns.
Formula: Revenue Generated/Ad Spend
“ROAS is not just a metric, it’s the scoreboard of your SEM strategy. A 4:1 ROAS means every $1 in ads returns $4 in revenue. Anything below 2:1 usually signals a serious issue.” — SEM Industry Benchmark Standard
The standard industry, margin, and business model benchmarks of target ROAS vary, though a general baseline is 4:1 of most e-commerce businesses. Even 2:1 ROAS is okay in service-based businesses where customer lifetime value is high.
Tracking ROAS by campaign, ad group, and keyword lets you allocate more budget to what’s profitable and pause what isn’t. Visit Exaalgia to see how our data-driven approach consistently improves ROAS for our clients.
6. Cost Per Acquisition (CPA) – The Real Cost of a New Customer
CPA (or Cost Per Conversation) informs you on how much you are spending to get each new customer or lead through your SEM campaigns.
Formula: Total Ad Spend/Total Conversions.
You must never have more than the target CPA that is below your average customer lifetime value (CLV). When you are spending $200 to gain a customer with lifetime value of 1,000 dollars, then your SEM campaigns are extremely profitable. When CPA is greater than CLV, you are losing money on each customer.
CPA optimization measures you should add to your dashboard assessment:
- Find high CPA keywords and either optimize their landing pages or put them on hold.
- With Google vectors using target CPA bidding to automate bids to your optimal acquisition cost.
- CPA by device, location and time of day to uncover inefficiencies that hide.
7. Impression Share – How Visible Are You Really?
Impression share (IS) is the percentage of the total possible impressions that your advertisements are actually delivering on. Assuming an IS of 60, your ads will be missing 40% of the searches that are eligible to receive your ad, in many cases, either because of budget constraints or because of low Ad Rank.
Google Ads divides impression share into two important sub metrics:
Lost IS (Budget): Stuff you are missing since your daily budget is now depleted.
Lost IS (Rank): Impressions you are losing due to the fact that your quality score or bid is not competitive enough.
For competitive industries, dominating impression share on your top converting keywords should be a priority. This ties directly into your strategy to integrate organic and paid visibility, as the effects of both will be multiplied.
8. Bounce Rate for PPC Traffic – Is Your Landing Page Working?
Bounce rate is the ratio of the number of visitors that leave your site without visiting any other page. In the case of PPC traffic, a high bounce rate is a warning sign that something is not in place, either the ad is setting the wrong expectation, or the landing page is not fulfilling the promise that the ad is making.
Checklist for reducing PPC bounce rate:
- Make sure that your landing page headline is an exact copy of your ad headline.
- Eliminate distracting navigation menus on special landing pages.
- Include trust signals (reviews, certifications, client logos) above the fold.
- Maximize page load time – should be less than 3 seconds on mobile.
- Have a single, concise CTA, do not ask the visitors to do a variety of things at the same time.
Having trouble identifying what is wrong with your landing pages that are not converting? Check our tutorial on how to optimize a landing page to maximise revenue, and how to increase quality score quickly.
How to Build Your SEM Analytics Dashboard
Having learned what metrics to monitor, here are the steps to create an efficient SEM analytics dashboard:
Step 1: Join Your Data Sources
Connect Google Ads, Microsoft Ads, Google Analytics 4, and any CRM data into a centralized dashboard tool – Google Looker Studio (free) is a popular choice.
Step 2: Set Your KPI Benchmarks
A baseline is necessary before you can quantify improvement. Take the current CTR, CPC, CPA, ROAS, and conversion rate and set them as baseline values.
Step 3: Create Segmented Views
Always be careful not to look at data in aggregate only. Build views by: Campaign type | Device or Geographic location | Time of day and day of week | Keyword match type.
Step 4: Install Automated Notifications
Set alerts when there is a spike in spend, CTR drop or conversion rate change greater than 20%. Creating early detection helps to avoid expensive harm to your campaigns.
Step 5: Plan Weekly Review
SEM data should be maintained frequently. Have weekly 30-minute performance reviews, adjusting bid and testing new ad variations. In case of businesses with weak internal capacity, it is possible to partner with a team that provides full-service digital marketing services and thus nothing can fall through the cracks.
Data-Driven SEM Wins Every Time
It is not only a reporting tool, but an SEM analytics dashboard is your competitive edge. When business owners know their metrics, they make decisions faster and smarter, utilize their budgets more effectively, and gain a lot more revenue with the same ad spend.
Our covered metrics: CTR, CPC, quality score, conversion rate, ROAS, CPA, impression share and bounce rate are the backbone of any successful paid search strategy. When you follow these regularly and act on the information they can give you, your SEM campaigns will become a reliable, scalable growth driver in your business.
That it is nearly always in the data, and in the skill which is needed to read and put it to good use.